Projets Spectroscopie
NGC 2392
Spectroscopic analysis
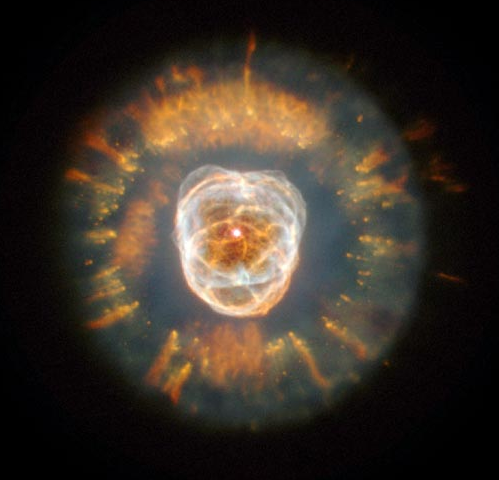
NGC 2392 "Eskimo nebula"
RA = 7 h 19 m 10.8 s
De = 20° 54' 42.5"Apparent magnitude = 10"
Apparent dimensions = 48" x 48 "
Fig 1. - NGC 2392 HST Image
Line identification
Line Intensity measures
Extinction
Dereddening
Temperature
Density
This page presents an analysis of the planetary nebula NGC 2392
Acquisition
Date : 06-04-2011
Exposure time : 2400 sec (8 x 300 sec)
Telescope : SC 25 cm
Spectrograph : LISA Slit 23 mcm R = 950
Spectrum processing : ISIS
Instrumental response computed with Alp Gem
Fig. 2 - The processed spectrum after geometric corrections and sky substracting.
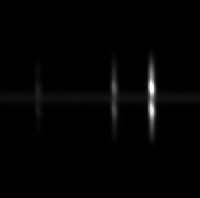
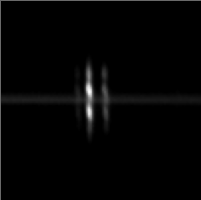
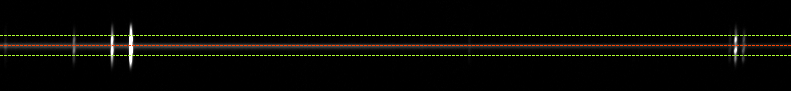
Fig. 3 - The [OIII] (left image) and H alpha region (right image). Note the complexe structure of the nebula revealed by the lines patterns
The extended nebulae are often heterogeneous in density, temperature, chemical composition.
It is therefore important to:
- reduce the area of integration of the spectrum and
- identify carefully the image of the autoguider the position of the slot
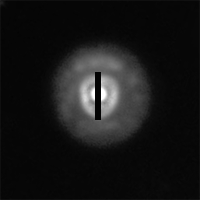
Fig. 4 - Approximative position of the slot reduced to the binning zone
Fig. 4b - The binning zone is 20 pixels high in the central region of the nebula.
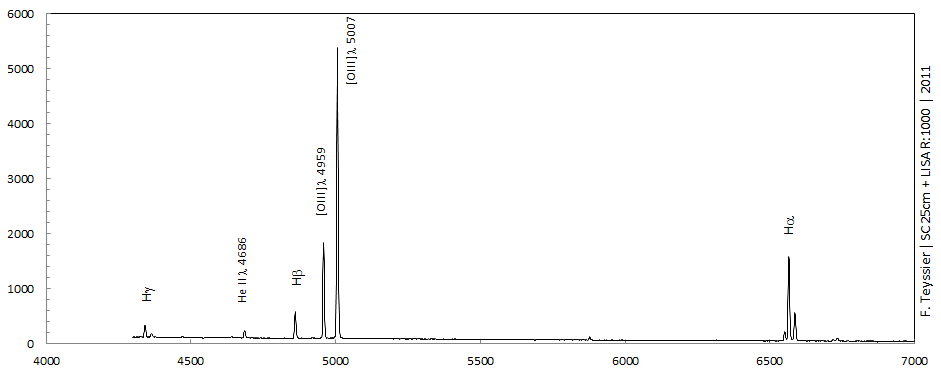
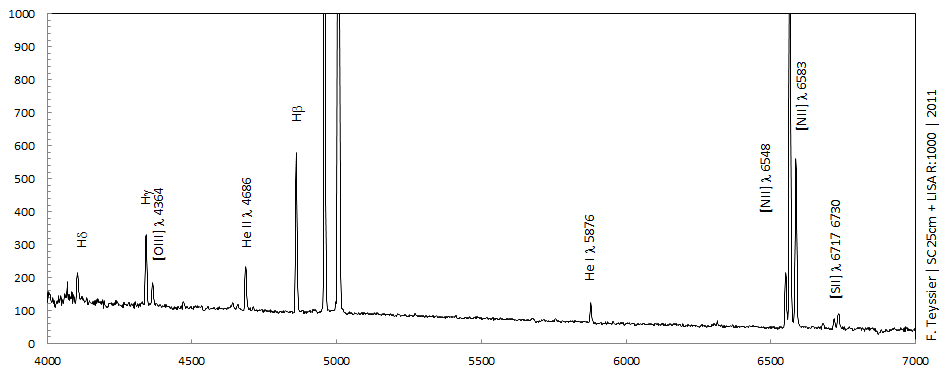
Fig. 5 - NGC 2392 shows a typical planetary nebula spectrum dominated by the [OIII] doublet. Fig. 6 - A dilated scale shows He II, which indicates high excitation but also the faint [OIII] 4364 auroral line and [SII] 6717,6730, well resolved. List of common lines in nebulae
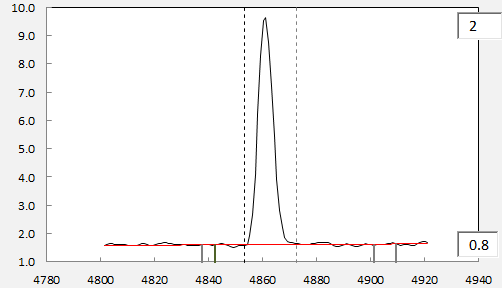
The lines relative intensity (F) is measured in an excel spreadsheet using two methods : 1. simple integration 2. gaussian fitting
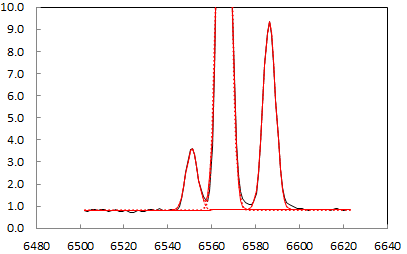
Fig. 7 - H beta : integration Fig. 8 - The measure of the [NII] doublet is affected by the proximity of the H alpha line implying the use of a gaussian fit procedure. It is realized with the Excel Solver.
Lambda 4340.47 4363.21 4685.68 4861.33 4958.92 5006.85 5754.57 5875.65 6548.06 6562.82 6583.39 6716.5 6730.7 Table 1 : observed intensities
Comparison between integration and gaussian fitting methods
Lambda 4340.47 4363.21 4685.68 4861.33 4958.92 5006.85 5754.57 5875.65 6548.06 6562.82 6583.39 6716.5 6730.7 Table 2 : observed intensities relative to I(H beta) = 100
The light emitted is reddened by interstellar. Interstellar reddening occurs when interstellar dust blocks blue light waves, allowing red light waves through, making stars appear redder than they are. The instellar reddening change the ration of the observed spectral lines .
The lines must be "dereddened". Here's the common method used for planetary nebulae, based on the theorical ratio of Balmer decrement.
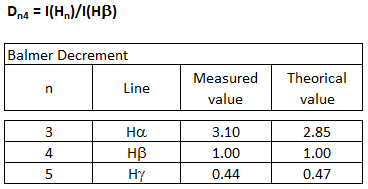
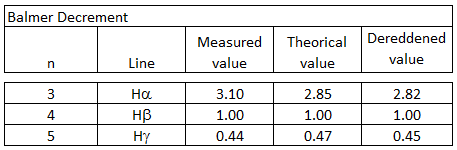
The intensities measures allow to calculate the Balmer decrements and to compare them to theorical decrement for Case B and Electron temperature = 10 000 K (values from Pottasch 1984).
The Balmer decrement for line n is noted : Dn4
Note : a more recent value for D34 is 2.86. The effect on the following mesures is very slight. This value should be changed in the excel spreadsheet.
Table 3 : Observed and theorical Balmer decrements
In the nebular approximation (low gas density), the difference between the observed and theorical values is assigned to interstellar reddening.
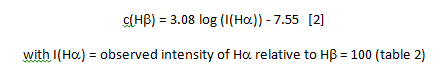
The extinction coefficient is calculated by the formula (Acker,:
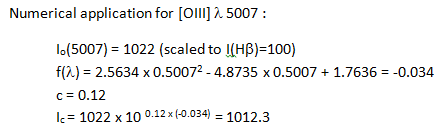
Numerical application :
c = 3.08 x log (309.8) - 7.55
c = 0.12
The extinction coefficient is in good agreement with published values.
Aller & Czyzak (1979) give c = 0.15, Barker (1991) finds c = 0.12The extinction coefficient allows to compute the colour excess = E(B-V) = c/ 1.46 [3]
Numerical application : E(B-V) = 0.08
Bright nebula interstellar extinction (c)
M76 [1] NGC 6572 [1] NGC 6720 [1] NGC 6803 [1] NGC 6853 [1] NGC 7009 [1] NGC 7027 [1] IC 418 [1] [1] Osterbrock &Ferland, 2006
The colour excess index is defined as the difference in the B and V bands of the light of a star relative to what it wolud be without colour attenuation by interstellar matter (Pradan & Nahar, 2011) :
E(B-V) = (B - V) - (B - V)o [4]
Extinction curve and line dereddening
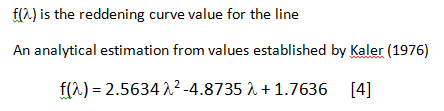
The line intensity is then dereddened using the formula :
[5]
with Lambda in micrometers
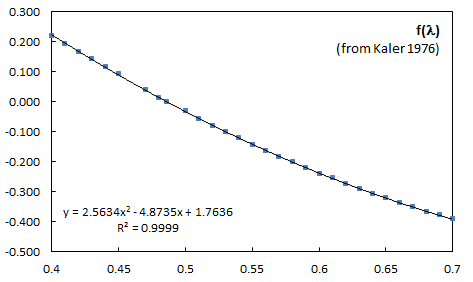
Fig.9 - Reddening curve (R = 3.1) computed from values established by Kaler (1976)
f(lambda) values from Kaler (1976) .txt File
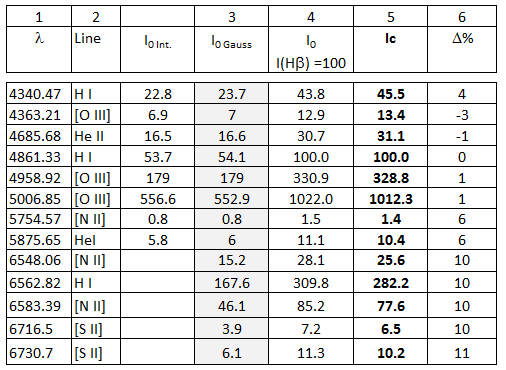
Table 4 : dereddened intensities
After exctinction correction, one can see that H alpha flux gives a Balmer decrement near the theorical value (2.82 vs 2.85)
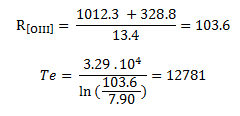
A method to determine the electronic temperature uses the ratio of some forbidden emission lines. It is based on several approximations (low density, nebulae optically thin in forbidden radiation, isothermal .
The more usual is [OIII] ratio wich gives the electronic temperature Te in a simplified form (Osterbrock & Ferland, 2006) :
[7]
[8]
Ne = electron density (cm-3)
Te = electronic temperature (K)Note : the theorical I(5007)/I(4959) ratio is 2.9
In planetary nebulae, the term 4.5 10-4 Ne.Te-1/2 is negligeble, so :
[9]
Numerical application
Te = 12800 K
In very good agreement with published values :
Henry & al. (2000) find a mean value of 12700 K for NGC 2392l
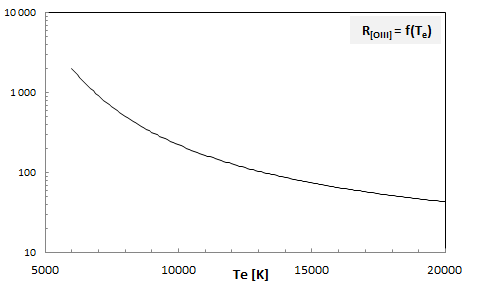
Fig. 10 - R[OIII] ratio as a function of the electronic temperature (Formula [7])
If the temprature increases, the auroral line [OIII] 4363 becomes brighter compared to nebular lines 4959 and 5007 .
The theorical ratio I(5007)/I(I4959) is 2.88
The observed values in a large sample of planetary nebulae is 3.01 +/- 0.23 (Acker, 1989).
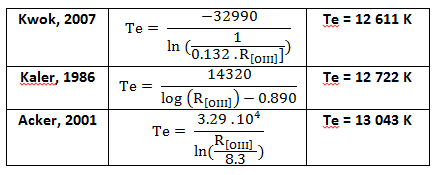
For NGC 2392, I find I(5007)/I(4959) = 3.08Others formula for Te [OIII] and the results for NGC 2392 :
The [NII] lines allows an other temperature estimation.
The ratio is computed for the nebular lines 6548, 6583 and the auroral line 5755.
This ration is useful for low excitation nebulae, where [OIII]4363 is very weak.
[10]
The formula from Osterbrock :
[11]
which gives : (4.5 10-4 Ne.Te-1/2 is again negliged)
[12]
Numerical application :
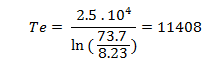
Te = 11 400 K
Also in almost good agreement with published values.
Henry & al. (2000) give 10 800 K (mean value)
and 11 450 K for the inner zone
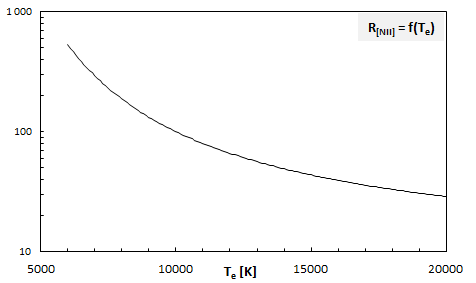
Fig. 11 - R[NII] ratio as a function of the electronic temperature (Formula [7])
.
The theorical ratio I(6583)/I(65848) is 2.95
The observed values in a large sample of planetary nebulae is 2.92 +/- 0.32 (Acker, 1989).
For NGC 2392, I find I(6583)/I(6548) = 3.03
.
.
.
.
.
The [NII] temperature is significantly lower than [OIII] temperature. This is a commun result in high exitation nebulae (He II strong).
Torres-Peimbert and Peimbert (1977) found that T(OIII) is about 1.25 times higher than T(NII) for objects of high degree of ionization, where I(HeII 4686) > 25.
T(OIII) ~ T(NII) for those of low degree of ionization.
The electronic density is evaluated using the ratio of forbidden lines rather insensitive to temperature.
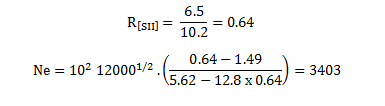
The most common determination is from [SII] ratio :
[13]
resp. [14] [15]
Source : Acker & Jaschek, 1995
Numerical application :
Ne = 3400 cm-3
Barker (1991) founds Ne = 3000 cm-3 for the central zone of the nebula
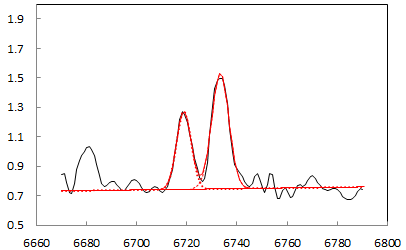
Fig. 12 - The [SII] 6716, 6730 lines fitted in excel spreadsheet.
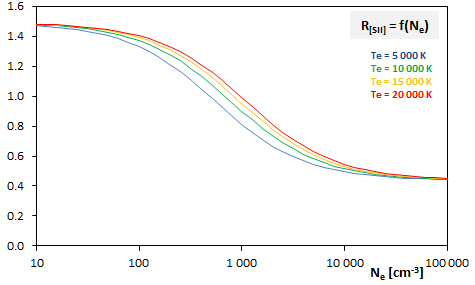
Fig. 13 - The R[SII] ratio is slightly dependant of Te. For the lowest densities, R[SII] tends to 1.48 ; for highest densites, it tends to 0.44
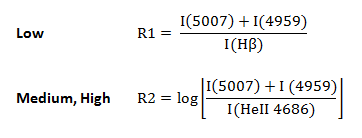
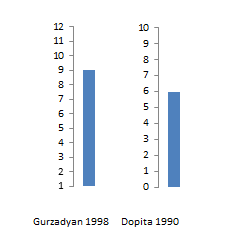
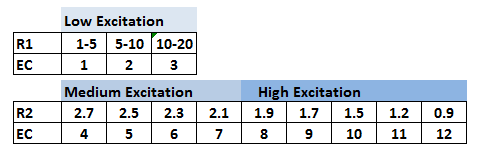
Excitation class
The different classifications uses :
- [OIII] for low excitation nebulae, where HeII 4686 is very weak or missing
- He II 4686 for medium and high excitation nebulae.There's two main classifications
Gurzadyan & Egikyan (1991)
Scale : 1 to 12
It is the most widely used.Dopita & Meatheringham (1990)
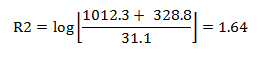
NGC 2692 :
Table 5 gives EC = 9
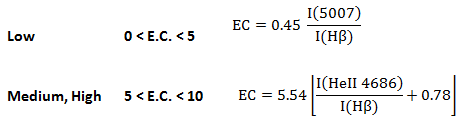
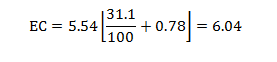
Scale : 0 to 10
NGC 2392 :
EC = 6
The excitation class is defined to use the nebular lines as a (loosely) measure of the central star temperature. High excitation nebulae will be those with very hot stellar nuclei. Others parameters inluence the excitation class, as nebula electron temperature and density, mass, structure, composition.
Table 5. Excitation classes (Gurzadyan & Egikyan,1991)
Results
Te [K] Te [K] Ne [cm-3]
Excel spreadsheet Link
- Some formulas uses decimal logarithm (log) others neperian logarithm (ln)
- Notations :
Te -1 = 1/Te
Te 1/2 = square root (Te)
Te -1/2 = 1/square root (Te)
Correction extinction Ver 2/2012-01-06/Correction of an error in f(lambda) thanks to Matin Dubbs
References
Astrophysics of gaseous nebula and active galactic nuclei
D.E. Osterbrock & G.J. Ferland, University Science Books, 2006The origin and evolution of planetary nebulae
S. Kwok, Cambridge astrophysics series, 2000, 2007Spectroscopy of nebulae
A. Acker in Astronomical Spectrogrophy for Amateurs, EAS Publications Series, 47 (2011) 189-214Atomic Astrophysics and Spectroscopy
A. Pradhan & S. Nahar, Cambridge University Press, 2011Astronomie, Astrophysique
A. Acker, Dunod, 2005Kaler J.B. , 1976, ApJS, 31, 517
Kaler J.B. , 1986, ApJ, 308, 322
Acker A. & al., 1989, ESO Messenger, 58, 44
Excitation classes
Gurzadyan, G.A., & Egikyan, A.E., 1991 , AP&SS, 181, 73
Dopita M.A., & Meatheringham S.J., 1990, ApJ, 357, 140
Reid W.A. & Parker Q.A., arXiv:0911.3689v2, 2011
NGC 2392 studies :
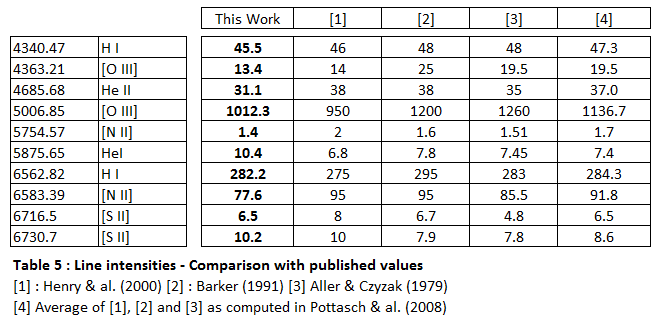
Pottasch S.R. and Bernard-Salas, J., 2008, A&A, 490, 715
Henry & al., 2000, ApJ, 531, 928
Barker T., 1991, ApJ,371, 217